
On 29 September 2026, I gave a PharmacoFlash talk in the pharmacometrics session at IATDMCT & SFPT 2026 in Rennes: three minutes of talk plus two minutes of discussion. We ended up with a spontaneous panel discussion and more time for questions than planned. I thought it would be nice to share both the talk and the main points from that discussion.
The talk is about the MTX Risk Calculator, a free web-based app for individualized risk predictions after high-dose methotrexate. The deck is essentially one slide that builds up click by click, so each image below shows the slide after one more click.
This post is based on a transcript of my spoken talk and my recollection of the discussion. I gave the transcript and the slides to an LLM and asked it to turn them into this post, staying close to what I said but making it grammatically correct and readable. The discussion section summarizes the questions and my answers from memory, so it is not a verbatim record.
Introduction
MTX Risk Calculator
It is my pleasure to talk about the MTX Risk Calculator, a full Bayesian NLME-based decision support tool for individualized risk predictions after high-dose methotrexate (MTX) in CNS lymphoma.
From MAP to MCMC
MIPD is still stuck in the 1970s

Model-informed precision dosing (MIPD) is still stuck in the 1970s. That is when Lewis Sheiner and Stuart Beal introduced the concept of maximum a posteriori (MAP) Bayesian forecasting to our field (Sheiner et al. 1979). More than 40 years later, it is still the predominant approach in MIPD.
I know “stuck in the 1970s” is a catchy line. The work of Sheiner and Beal was really important and revolutionary at the time, and MAP forecasting was a perfect fit for the computing power available in the 1970s. My point is simply that the computing power we have today allows us to go further.
The limitations of MAP
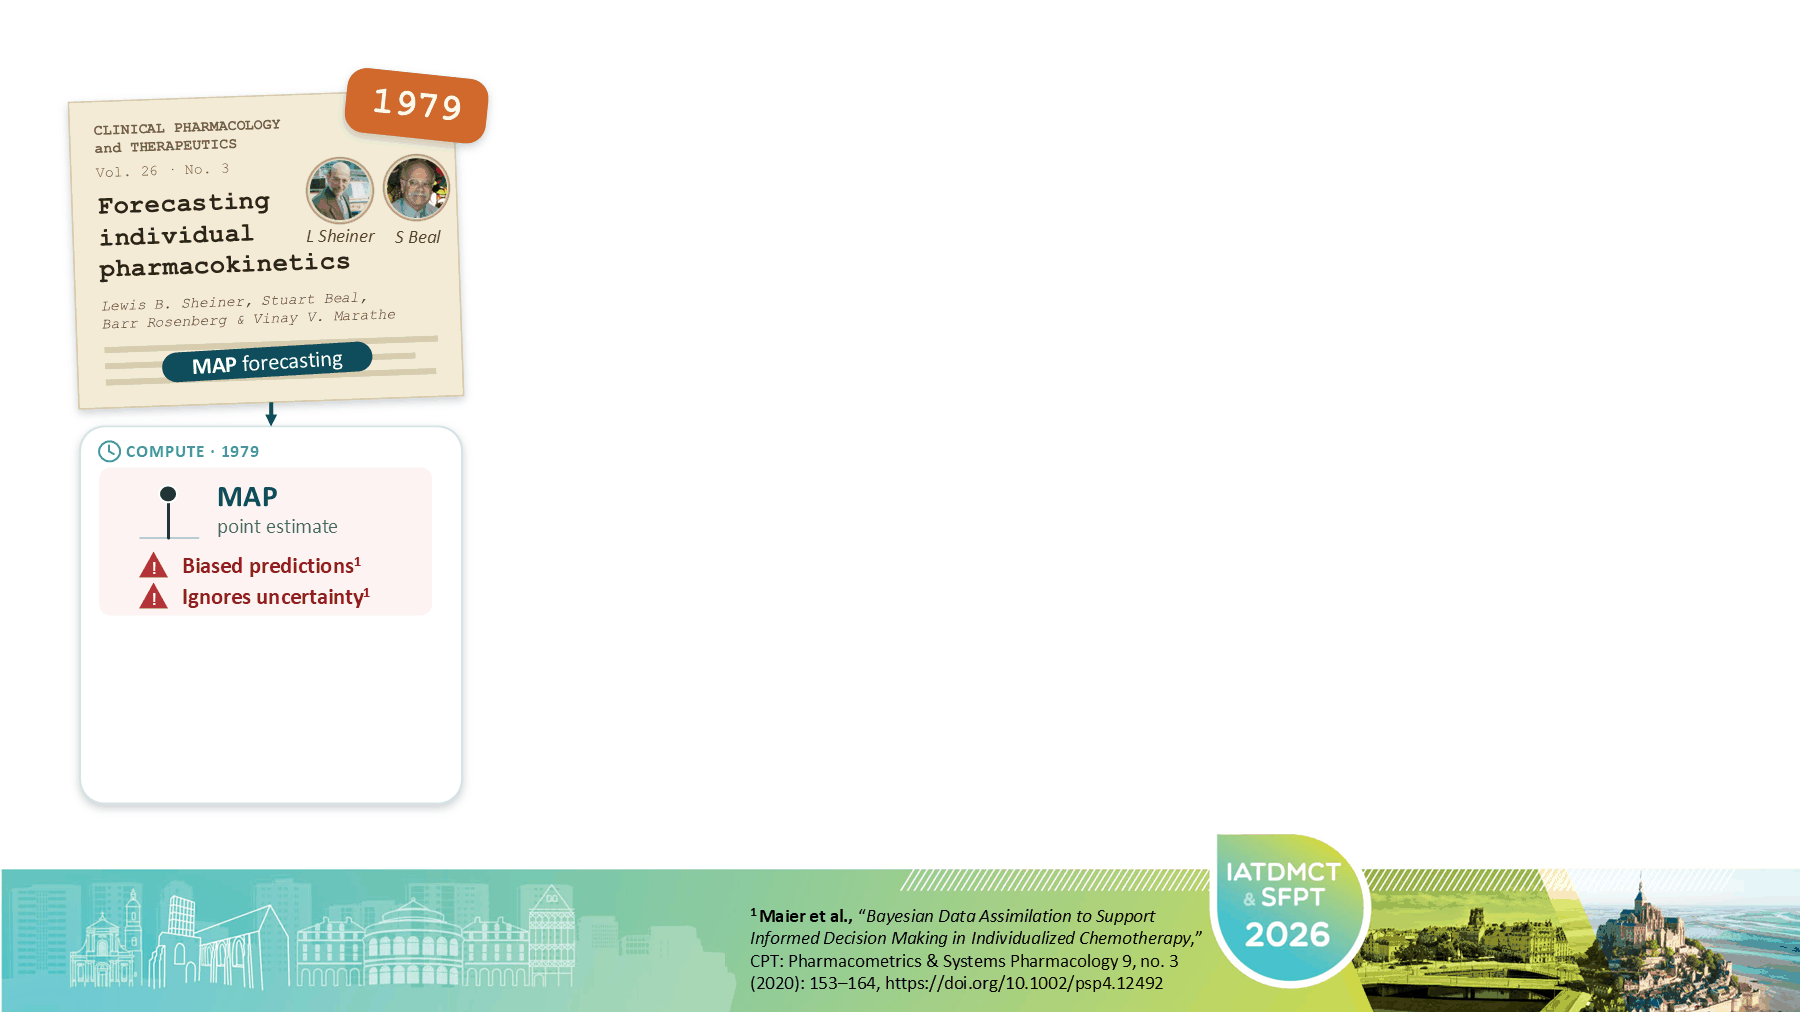
However, there are clear limitations. MAP estimation can bias predictions (Maier et al. 2020), and it completely ignores predictive uncertainty. But isn’t clinical decision-making inherently based on risks and probabilities?
Full Bayesian inference with MCMC
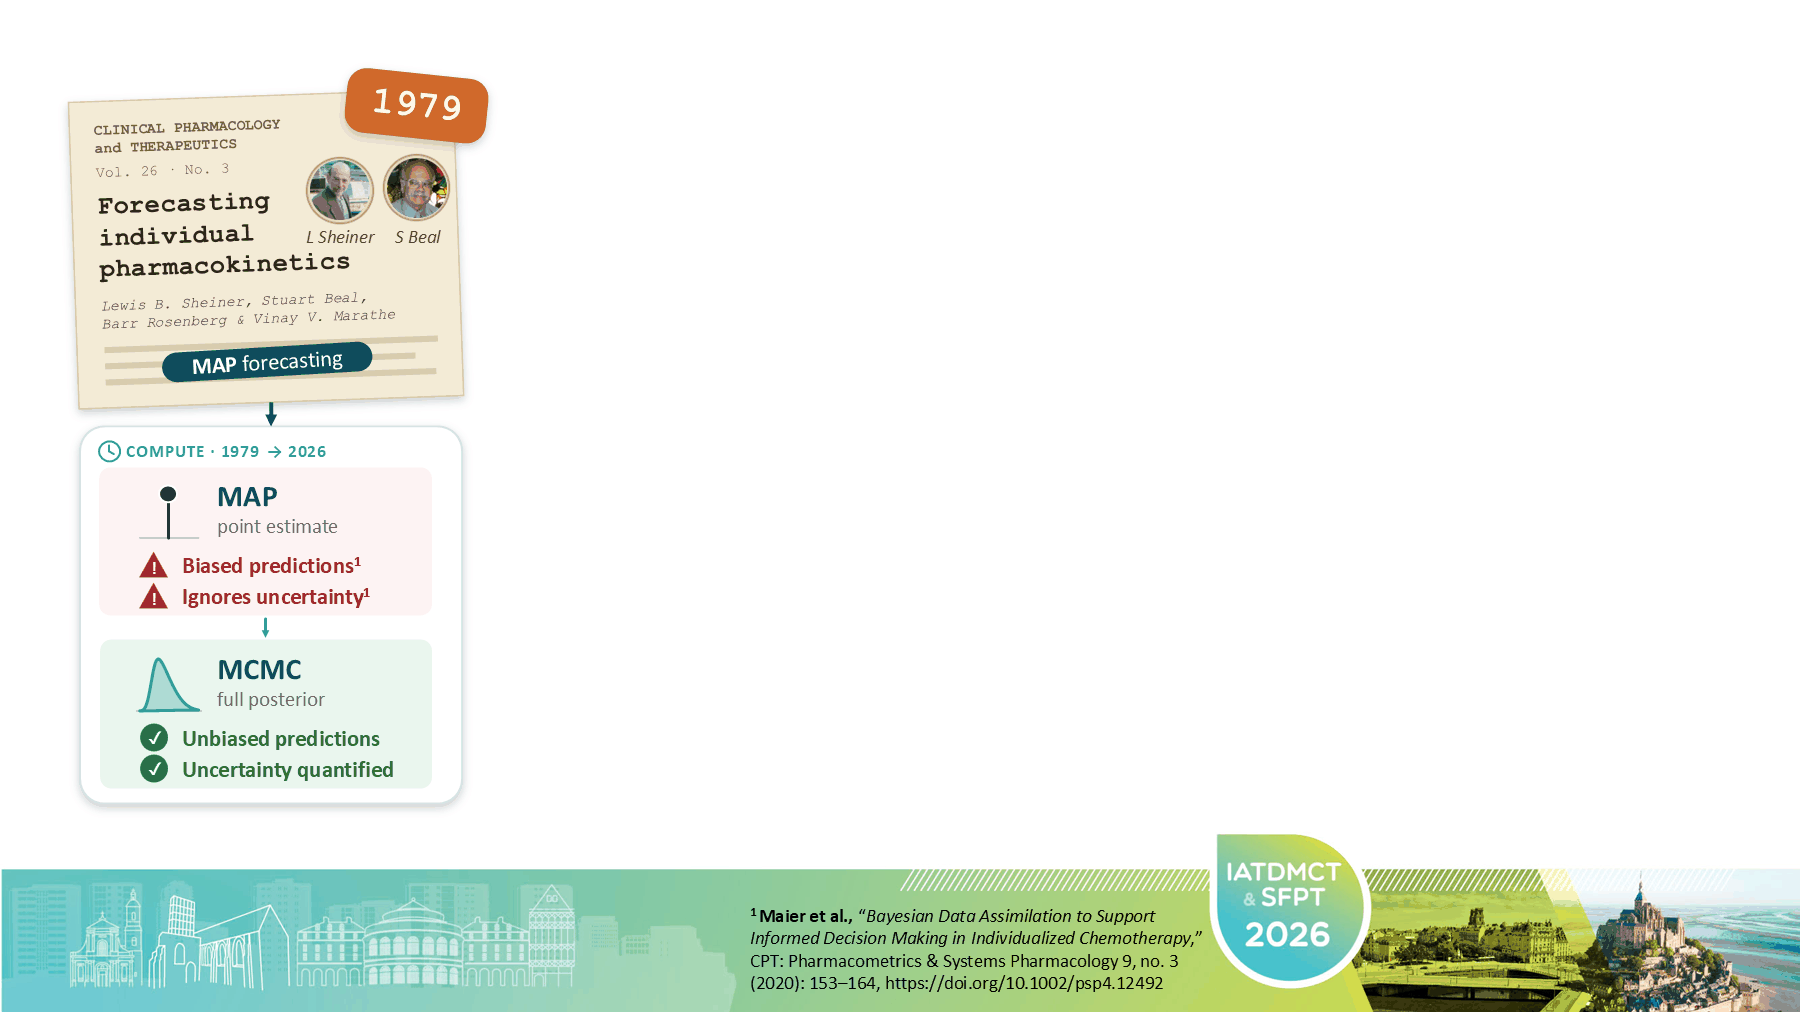
This is why I argue that we should move towards full Bayesian approaches, such as Markov chain Monte Carlo (MCMC), which are unbiased and naturally quantify uncertainty.
Case example: high-dose methotrexate
High-dose methotrexate in CNS lymphoma
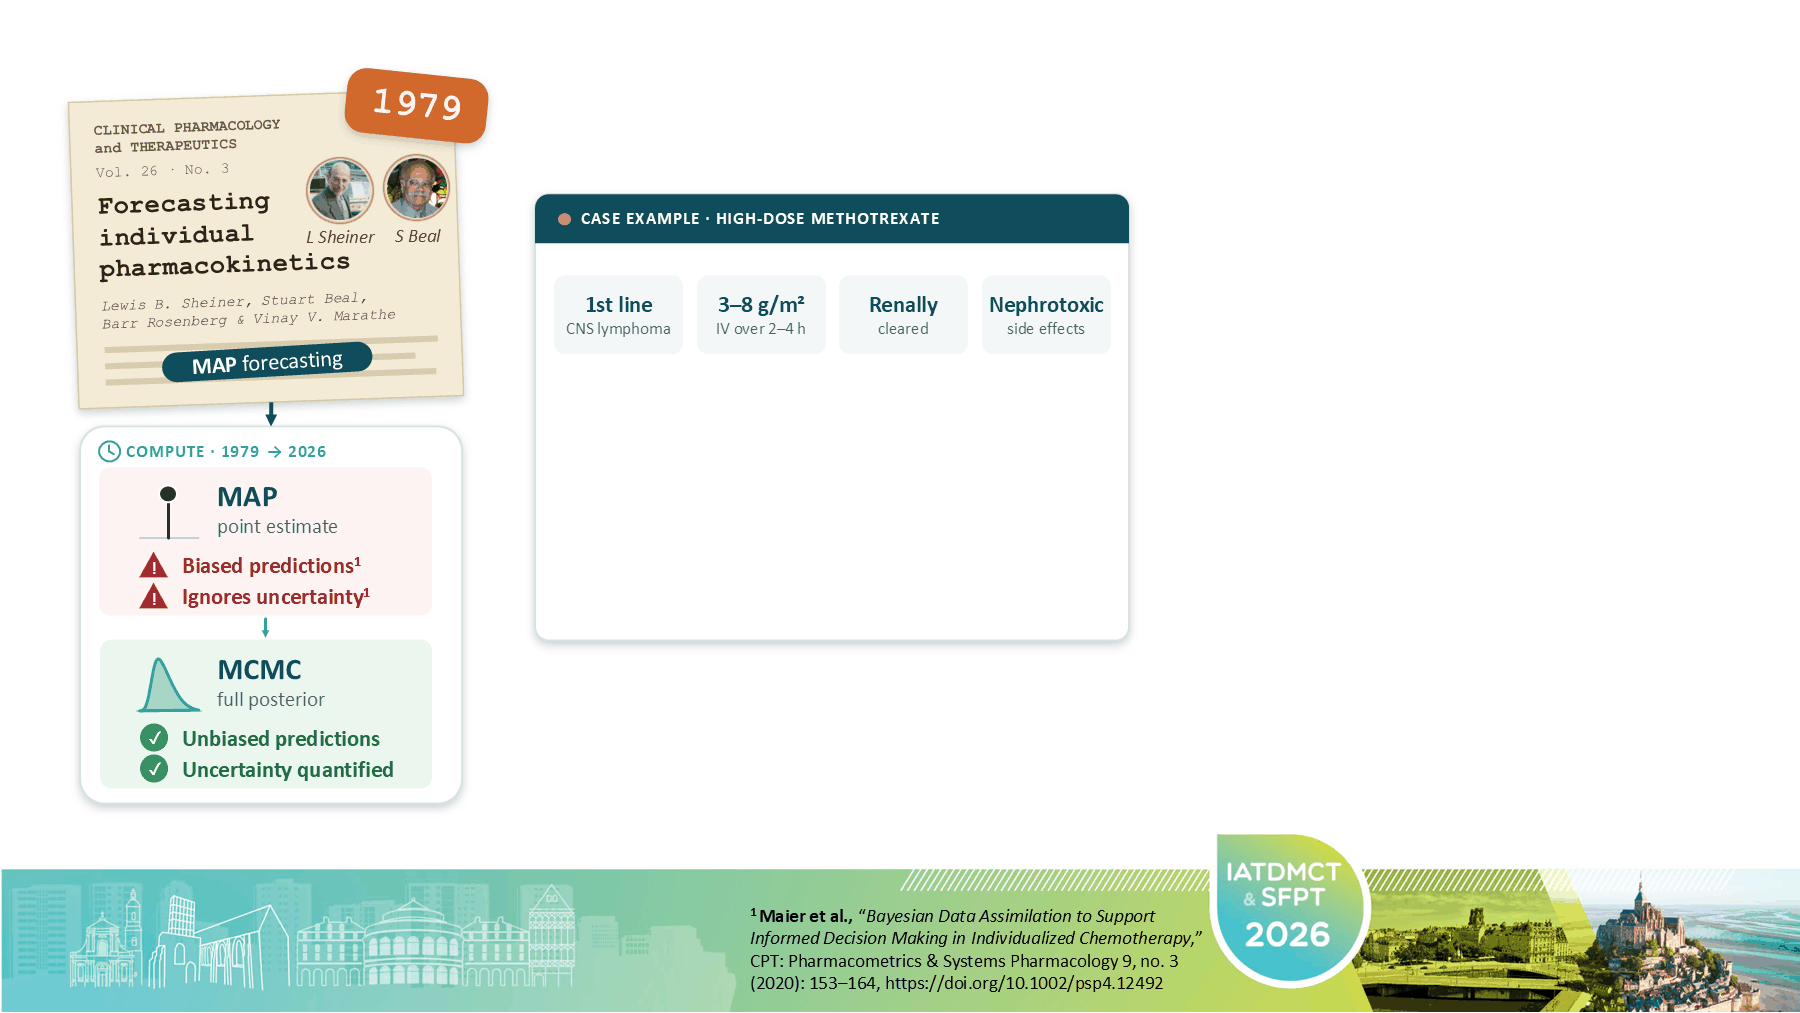
Let me illustrate this with a case example. High-dose methotrexate is a first-line treatment for CNS lymphoma and other malignancies. We infuse several grams intravenously over a couple of hours. However, there is a catch: methotrexate is renally cleared,
A vicious cycle
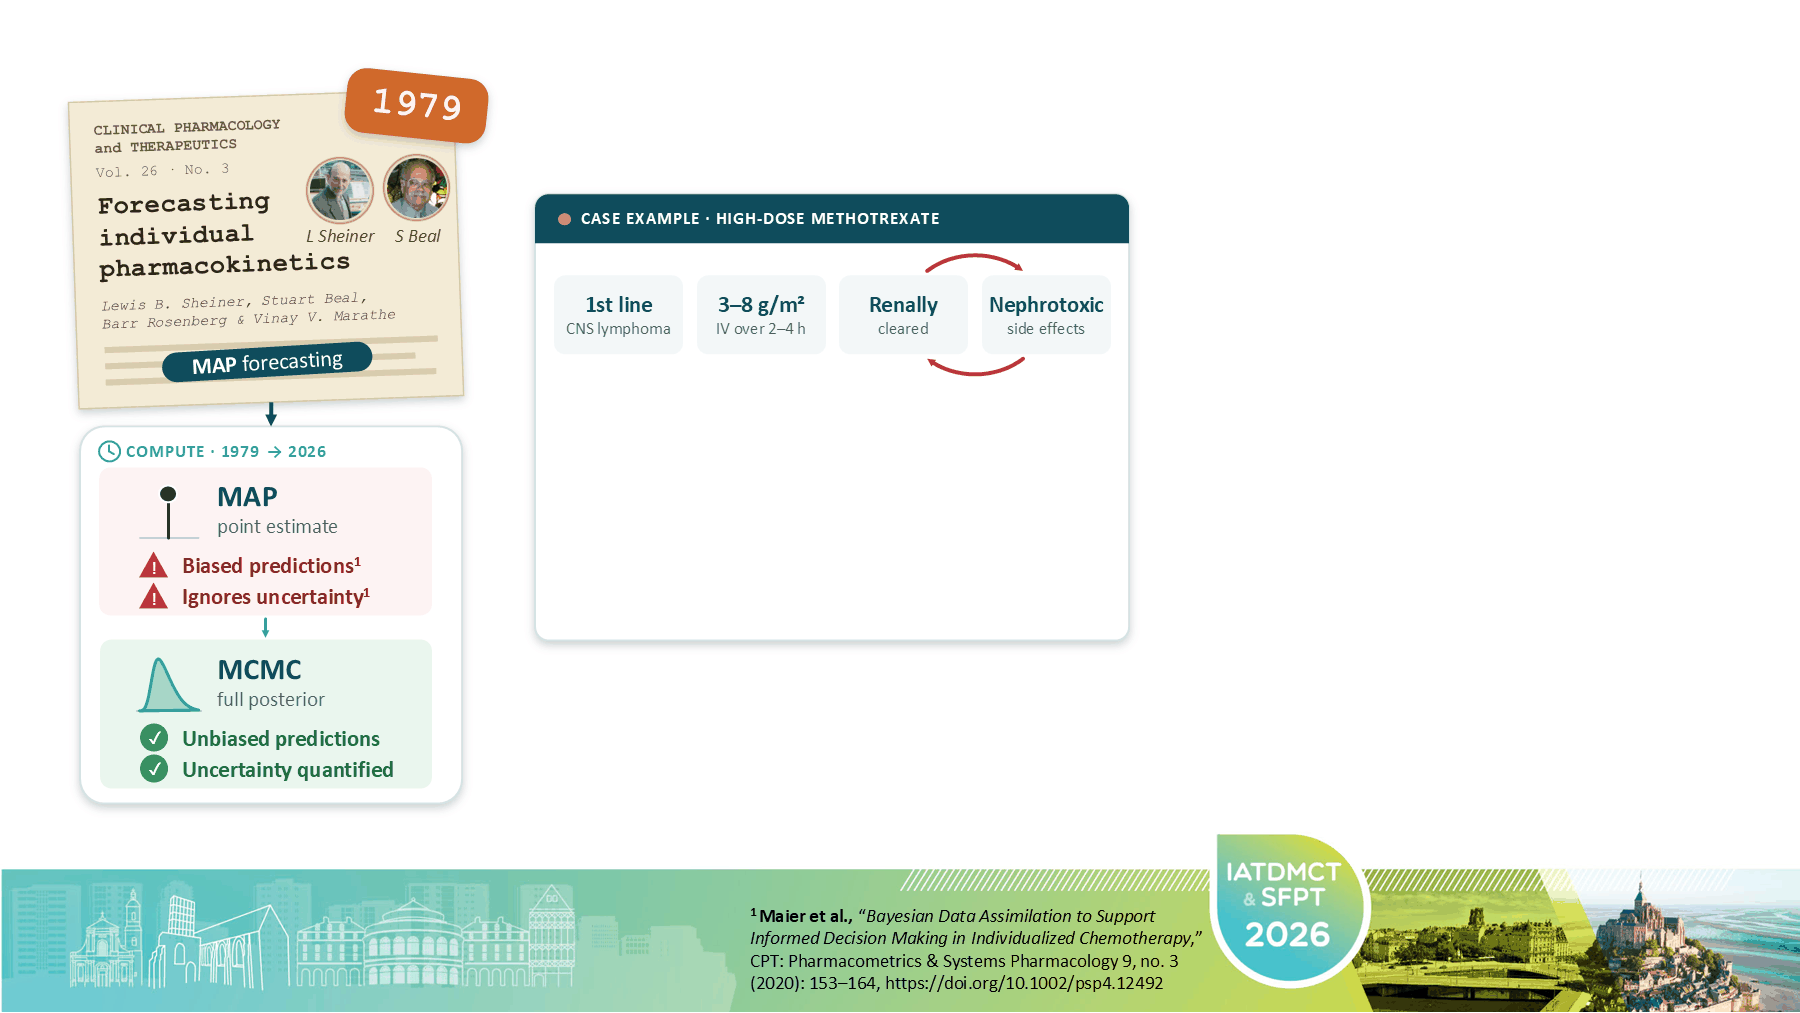
while it also has nephrotoxic effects. For some patients, this can lead to a vicious cycle, which is a real worry for clinicians.
Delayed elimination
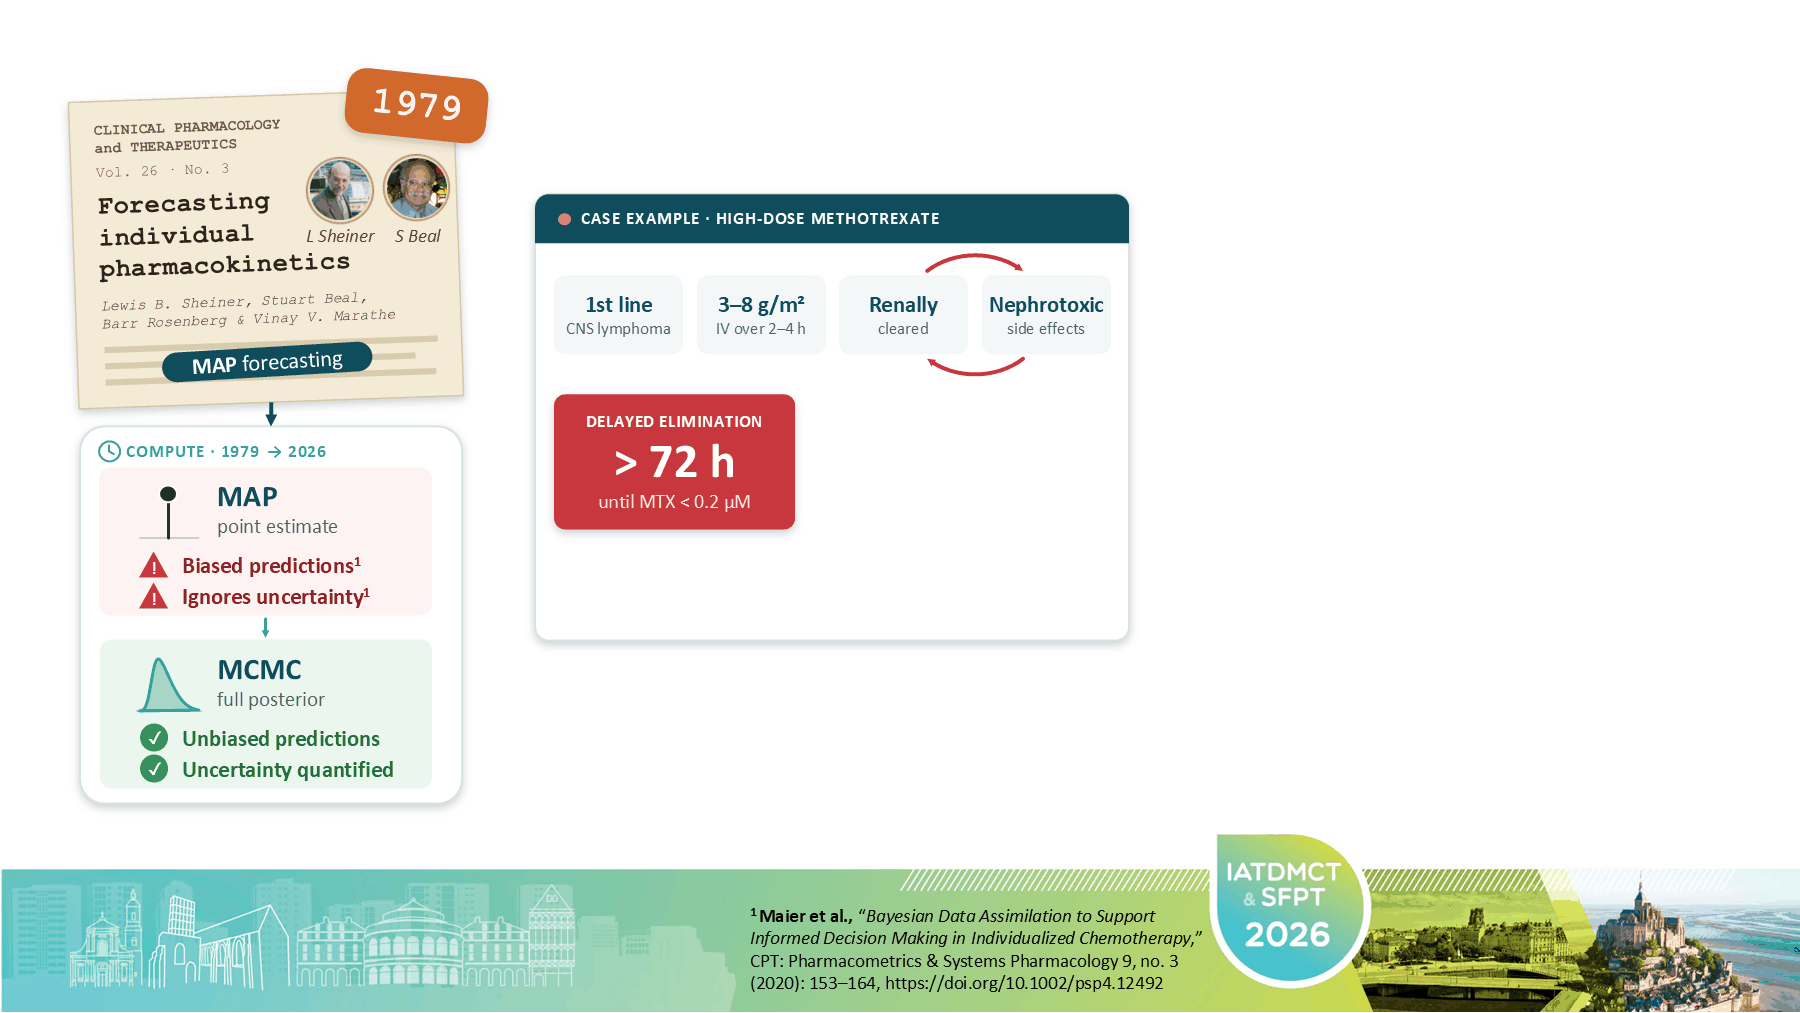
We classify a patient as having so-called delayed elimination when it takes more than 72 hours, or three days, for the methotrexate concentration to drop below 0.2 µM.
This is not the only definition of delayed elimination. Some hospitals, for example, wait until the methotrexate concentration has dropped below 0.1 µM, and the exact threshold depends on the guideline being followed. For this work, we stuck to the definition above.
Severe toxicity
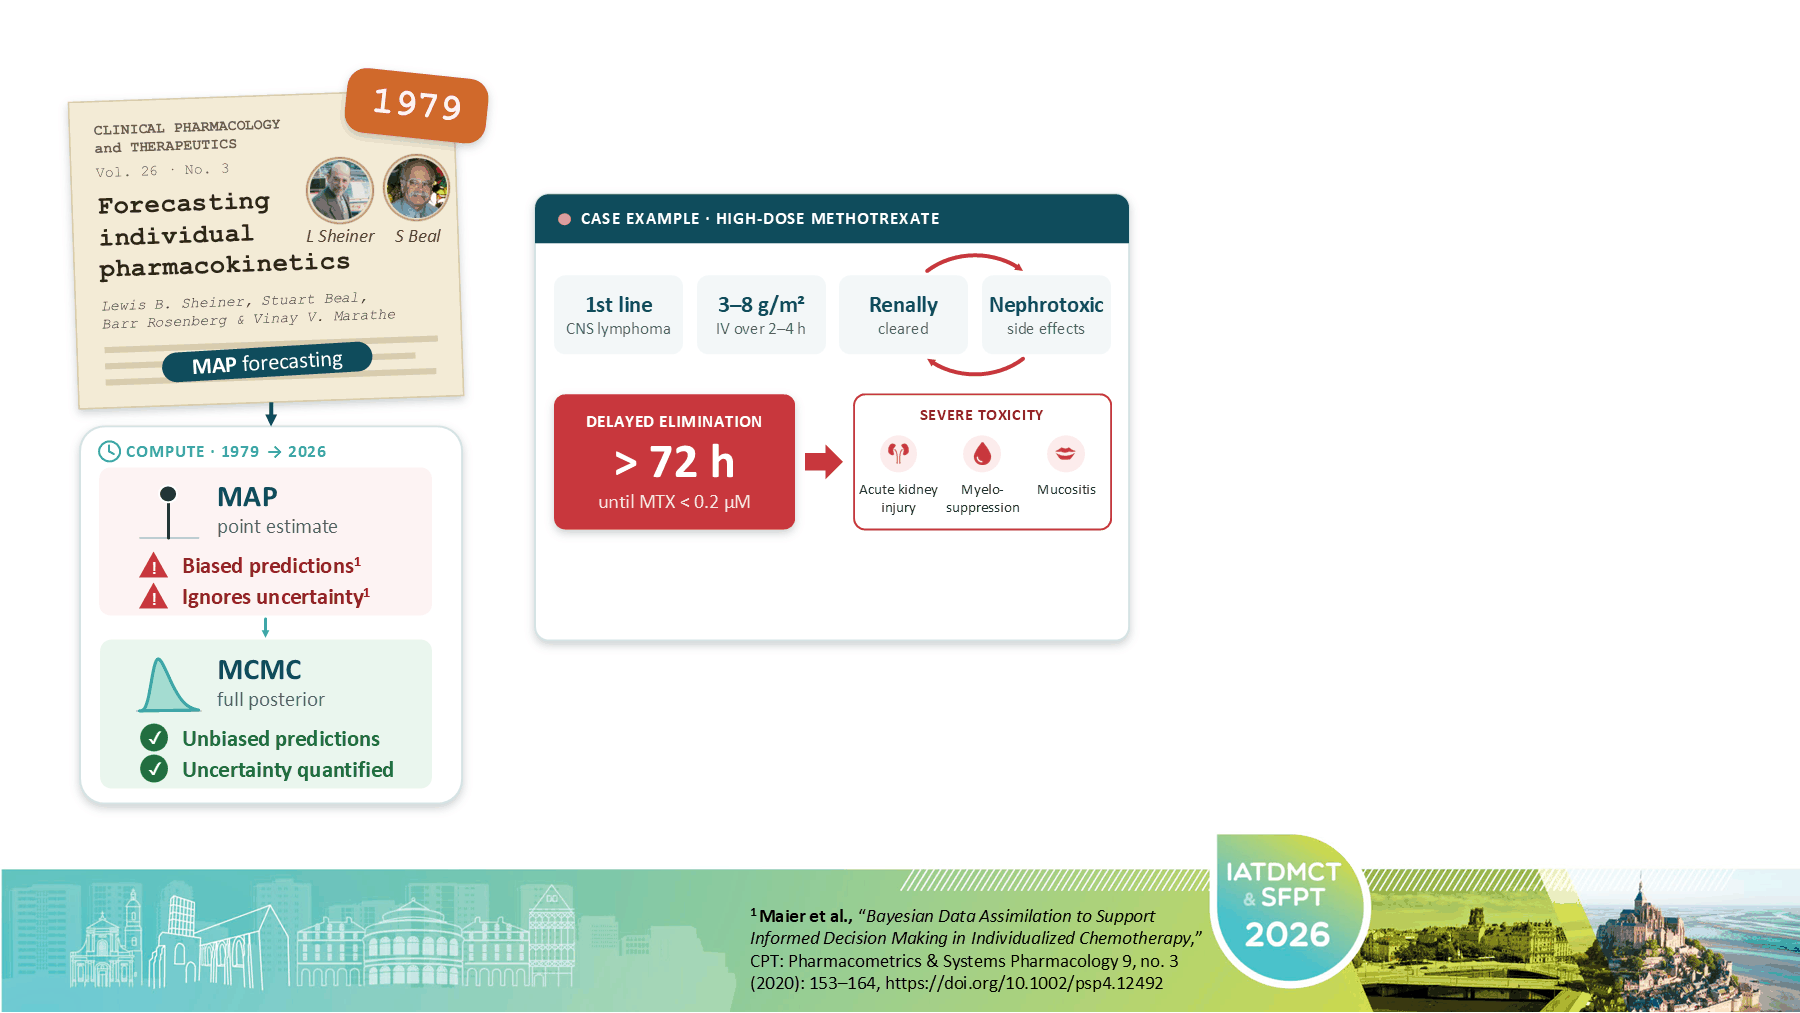
This state is associated with severe toxicity, such as acute kidney injury, myelosuppression, mucositis, hepatotoxicity, and neurotoxicity, which can potentially be fatal.
Rescue is a judgment call
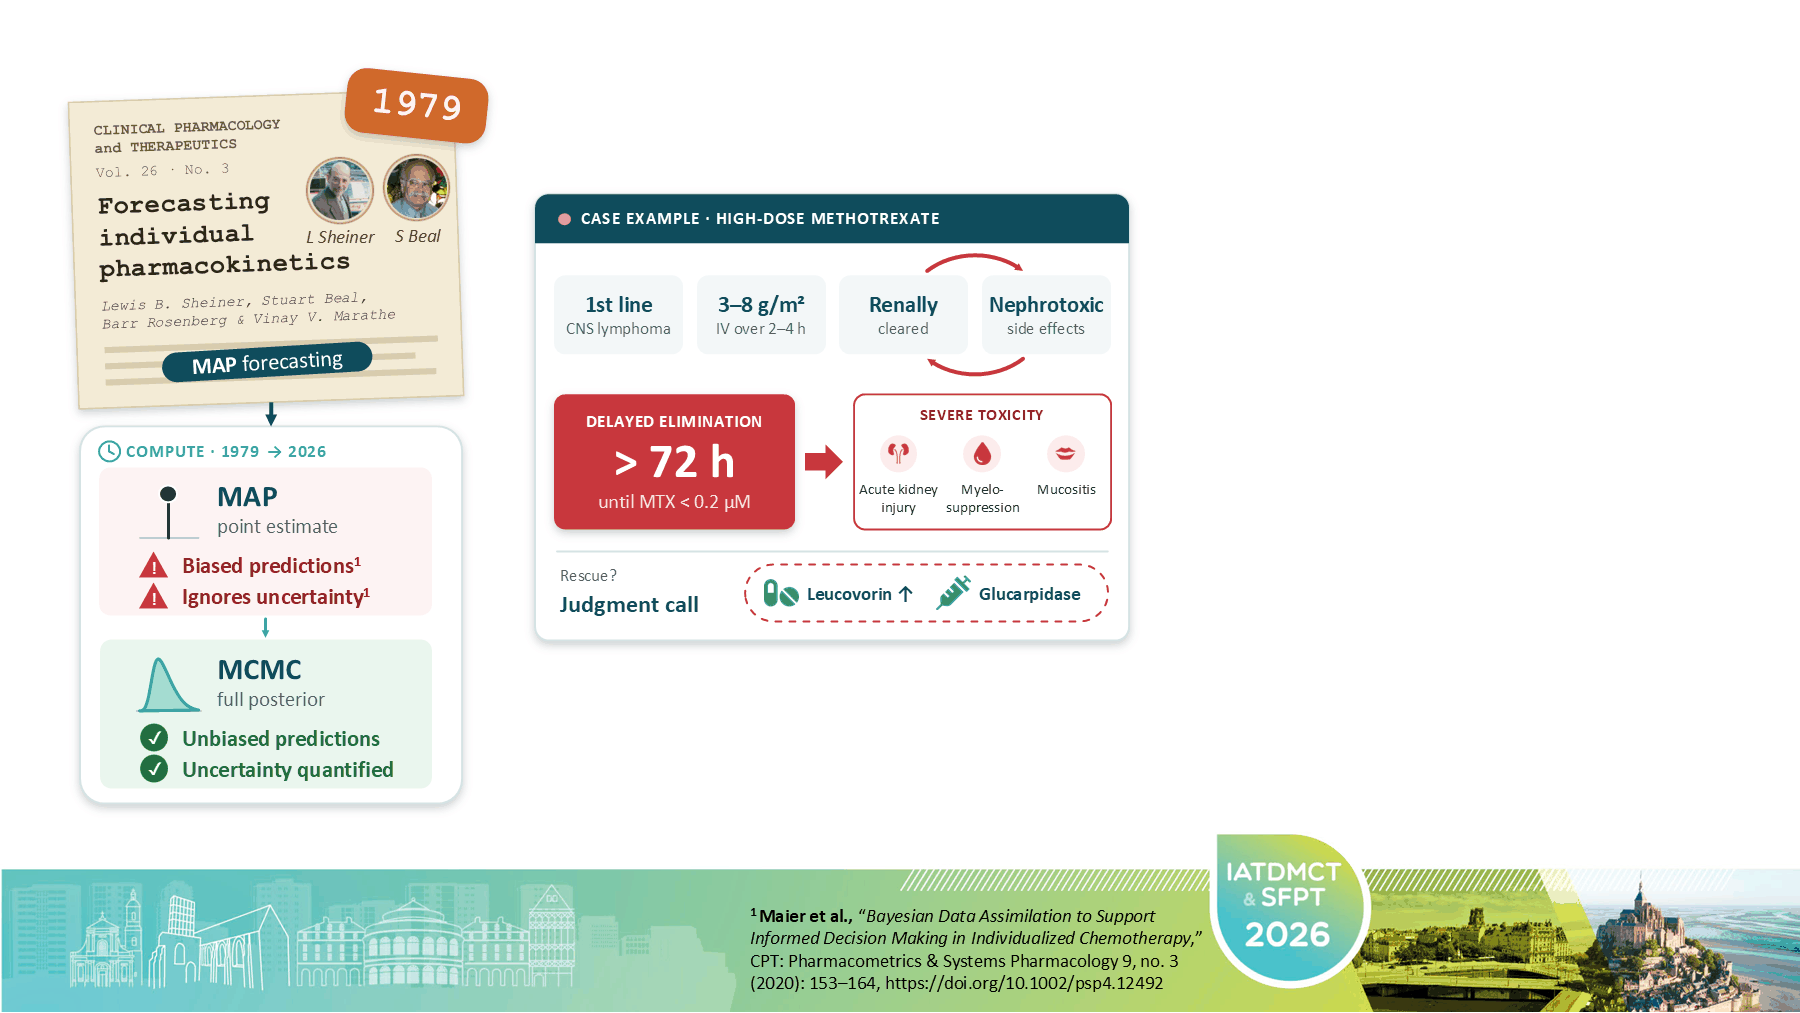
Clinicians therefore have to make a judgment call. Do they want to intensify leucovorin rescue early on after administration? And/or do they want to rely on a last-resort enzyme called glucarpidase? Glucarpidase rapidly hydrolyzes methotrexate, but it is also quite costly, at up to €100,000 per therapy.
From model to app
A population PK model
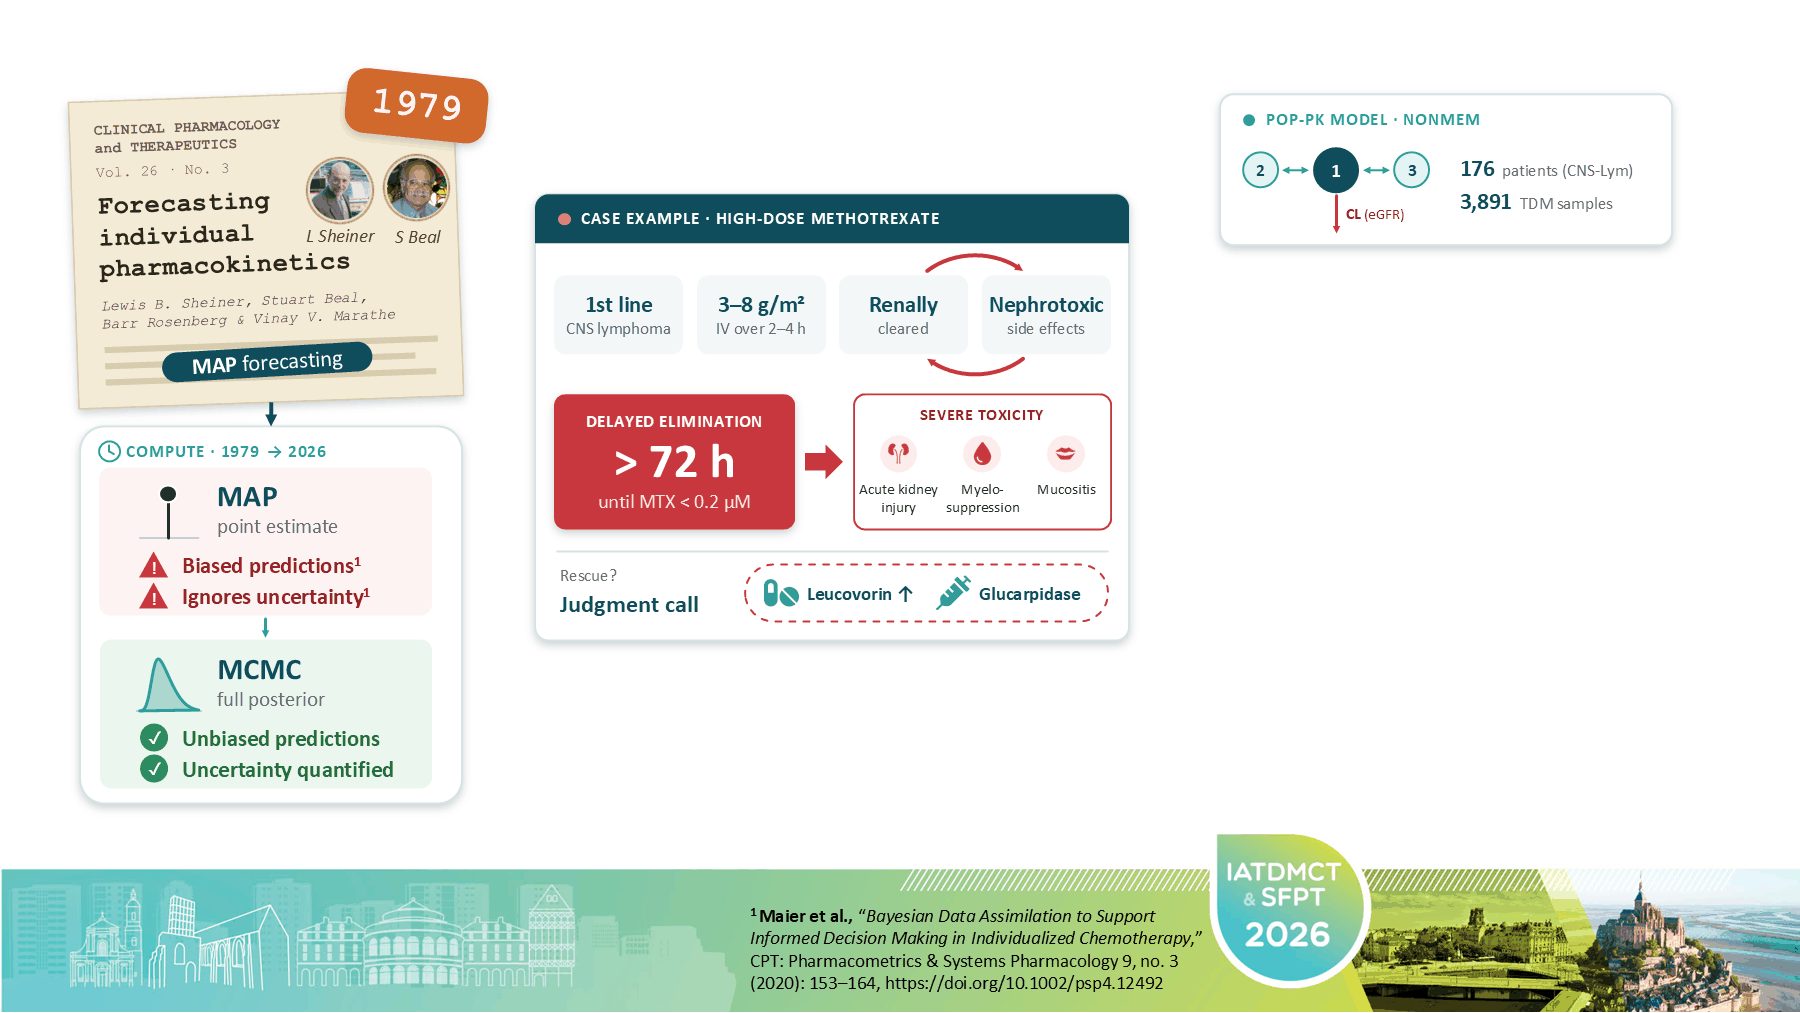
We wanted to support this judgment call. So we developed a population pharmacokinetic (PK) model in NONMEM based on clinical routine data from our collaboration partners at the Klinikum Stuttgart,
Full Bayesian inference in Stan
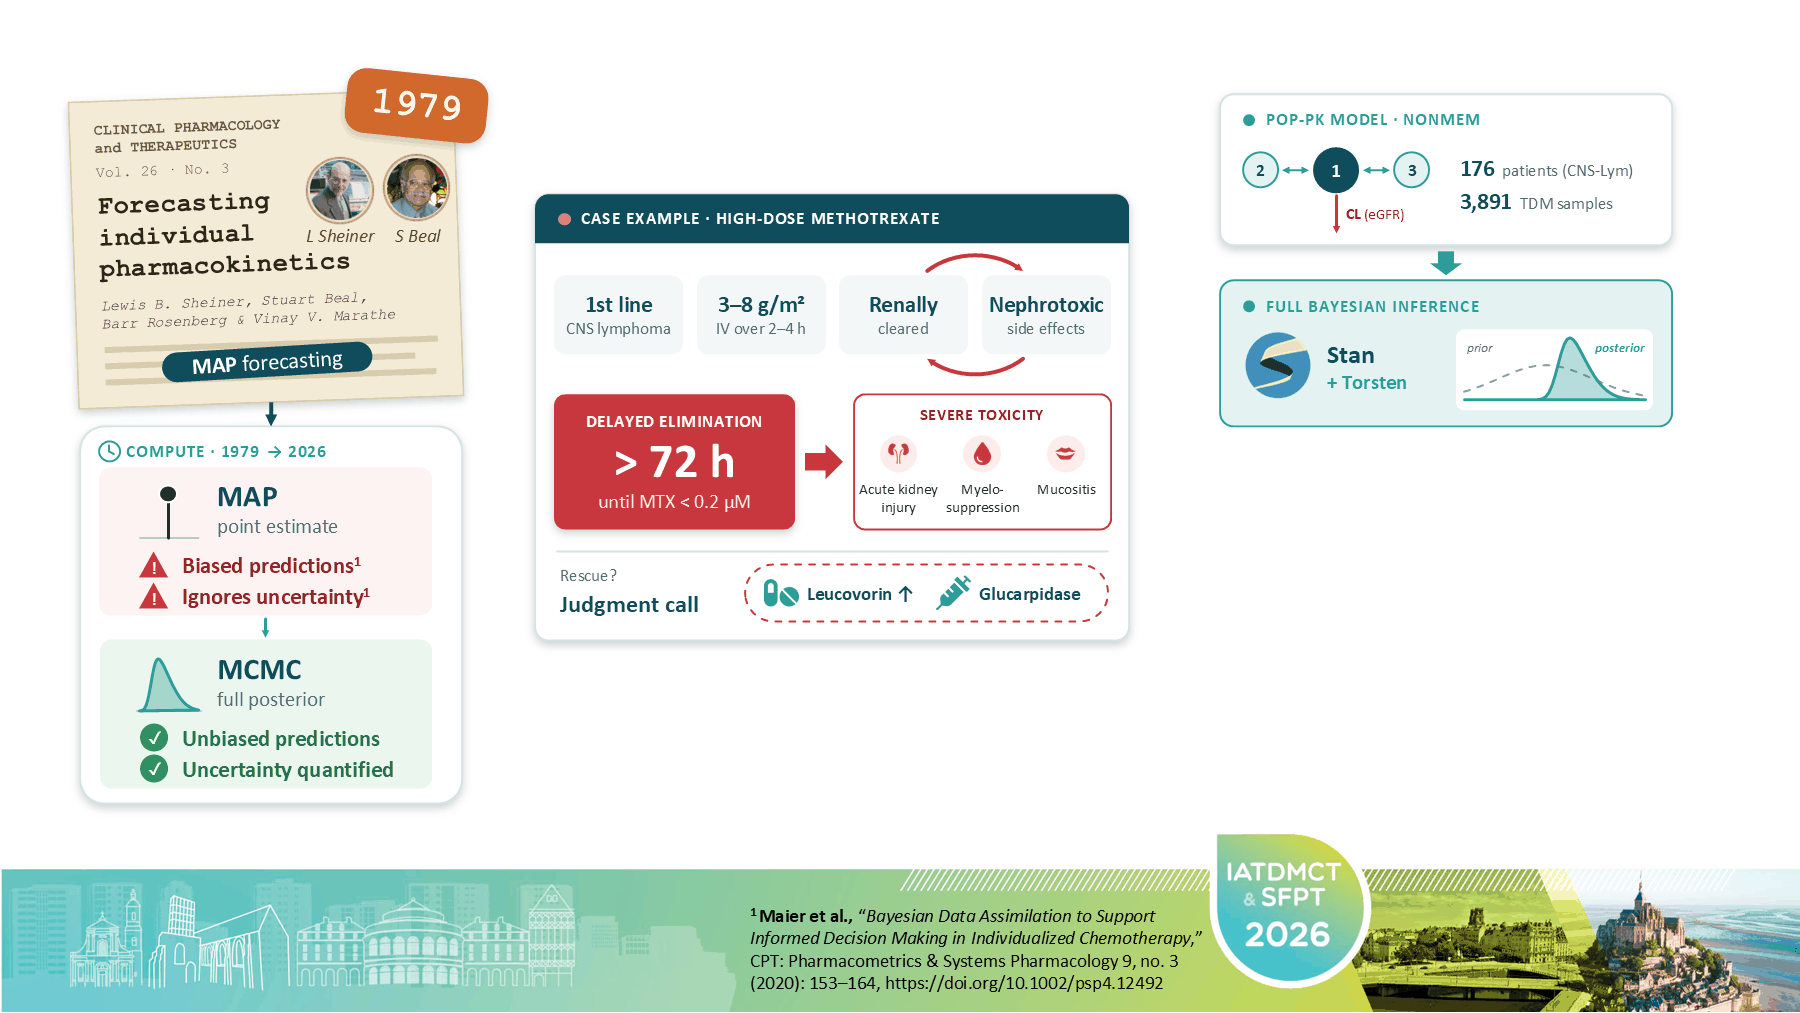
then transferred the model to full Bayesian inference software, Stan and Torsten,
The MTX Risk Calculator
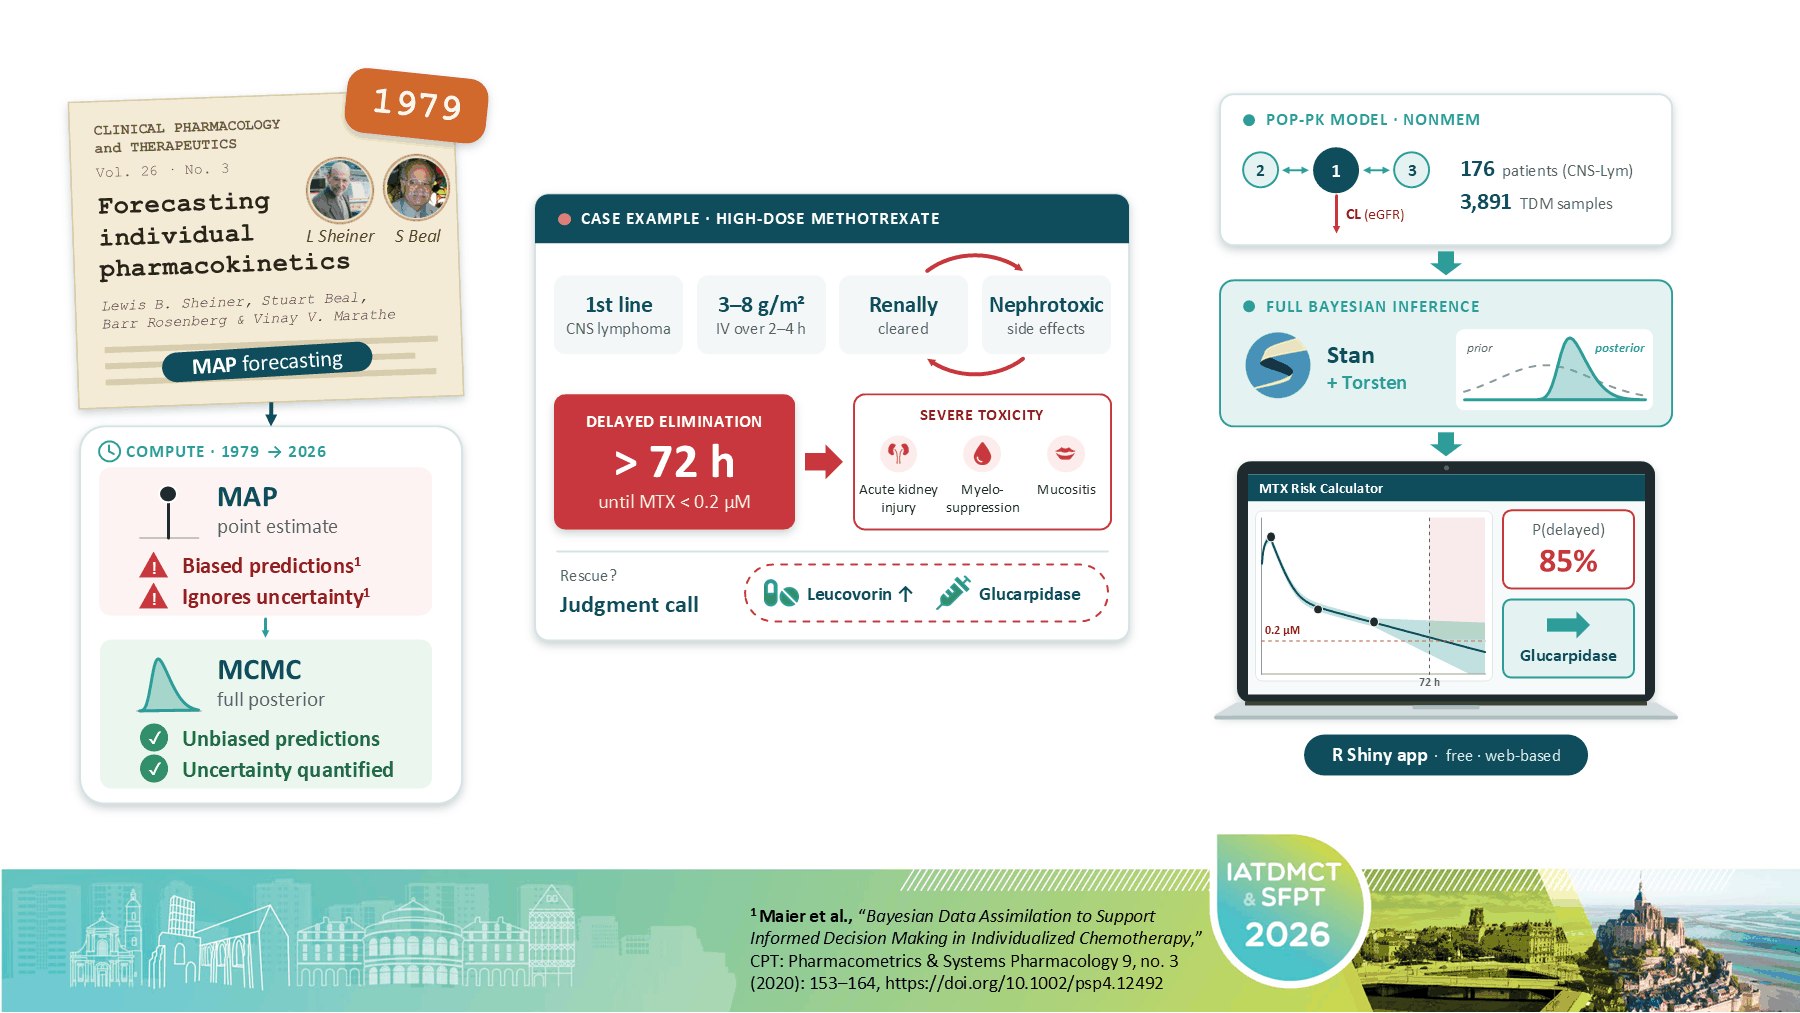
and finally wrapped an R Shiny app around it, which makes this functionality available to the attending clinicians.
We are not the first to bring model-informed decision support for high-dose methotrexate to the clinic. A great example is MTXPK.org by Taylor et al. (Taylor et al. 2020), a more sophisticated app that, for example, supports decisions on the use of glucarpidase. It is currently MAP-based and does not quantify uncertainty, but it shows nicely what is already possible and that other concepts are heading in a similar direction.
The app in action
A walk through the app

In the next minute, I would like to walk you through the MTX Risk Calculator. But please be aware that this is not a medical device and that it is still under active development, so please do not use it at the bedside yet.
Adding a patient
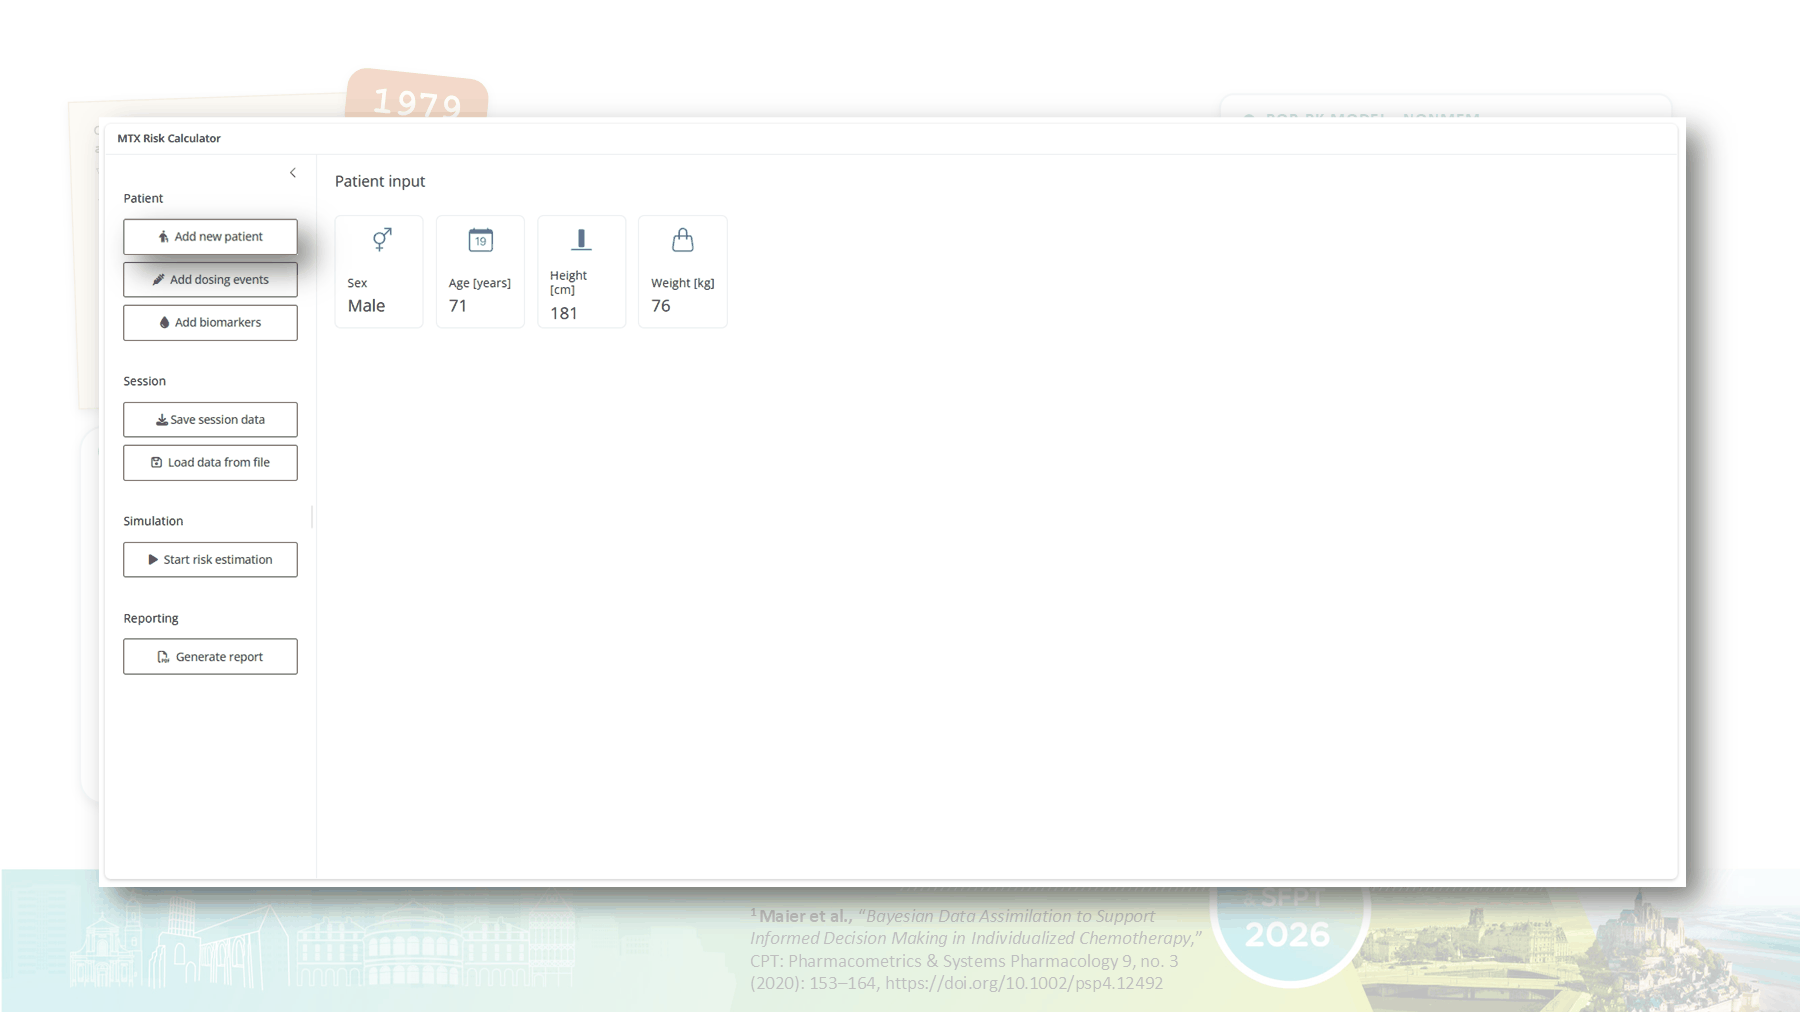
First of all, you can add a patient,
Adding dosing events
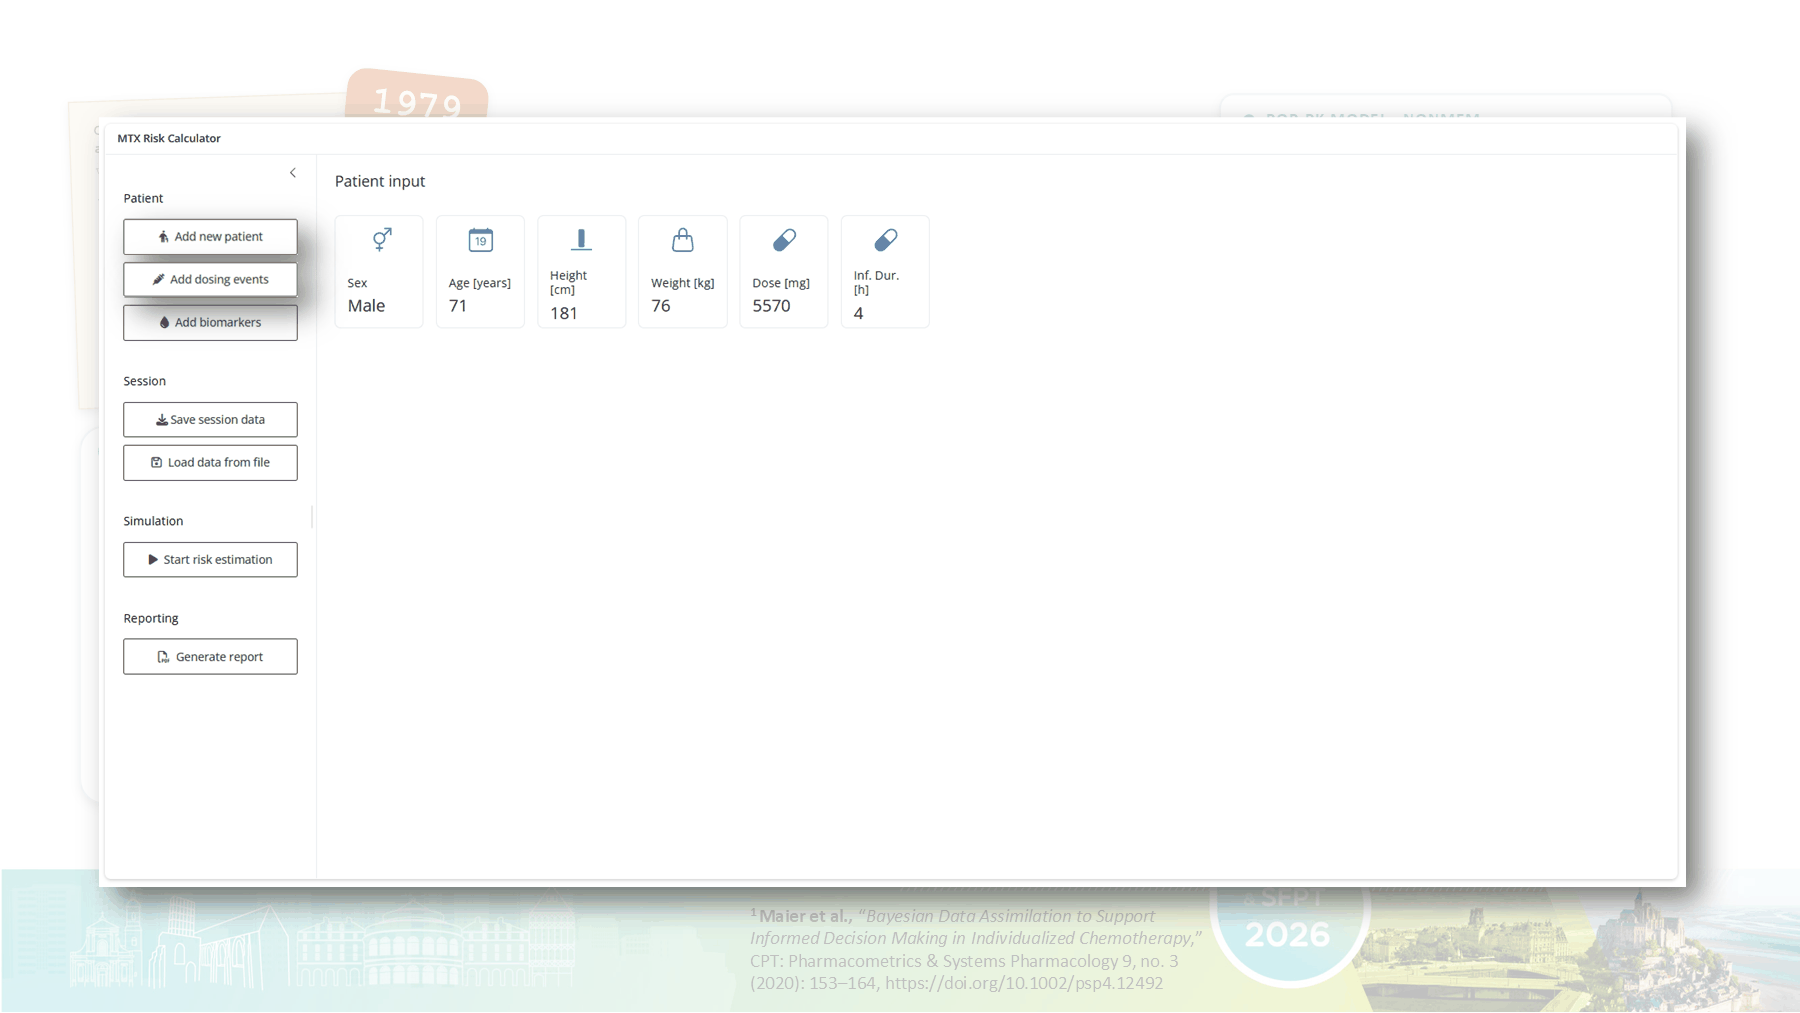
add dosing events,
Adding biomarkers and TDM data
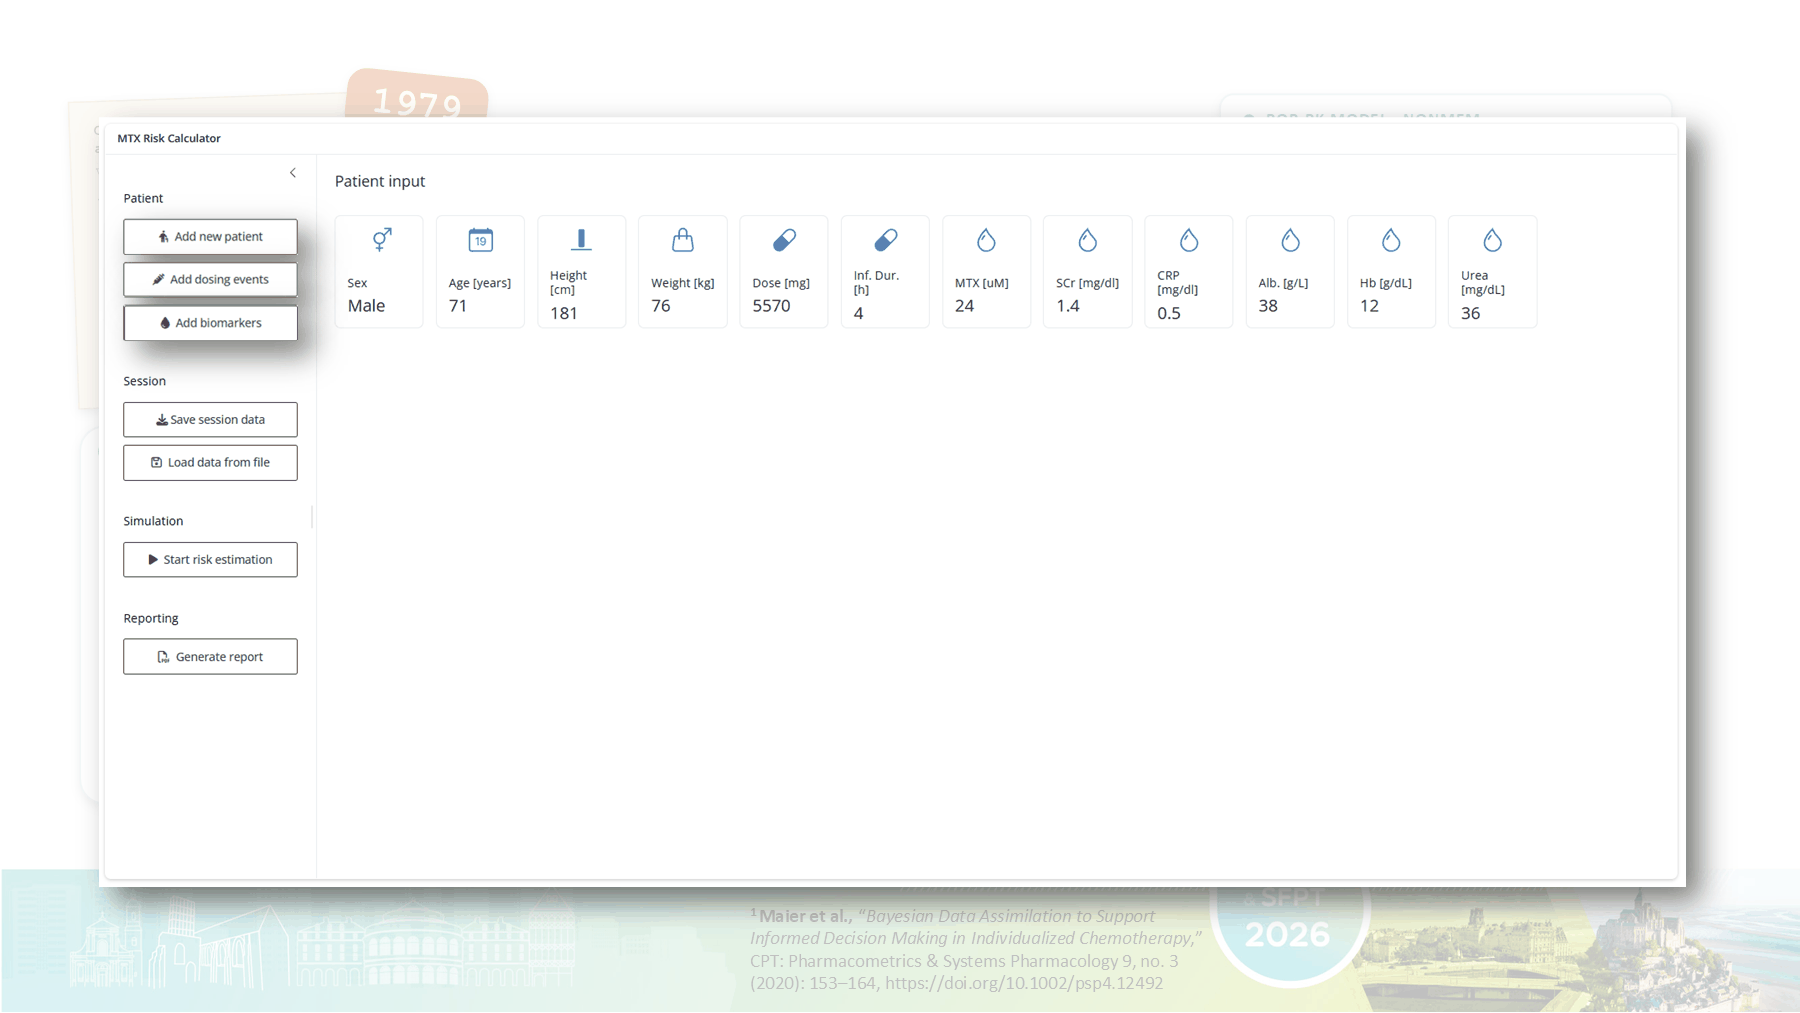
and add biomarkers and therapeutic drug monitoring (TDM) data. After you submit each pop-up, you directly get a visual confirmation of what you have just entered.
Starting the risk estimation
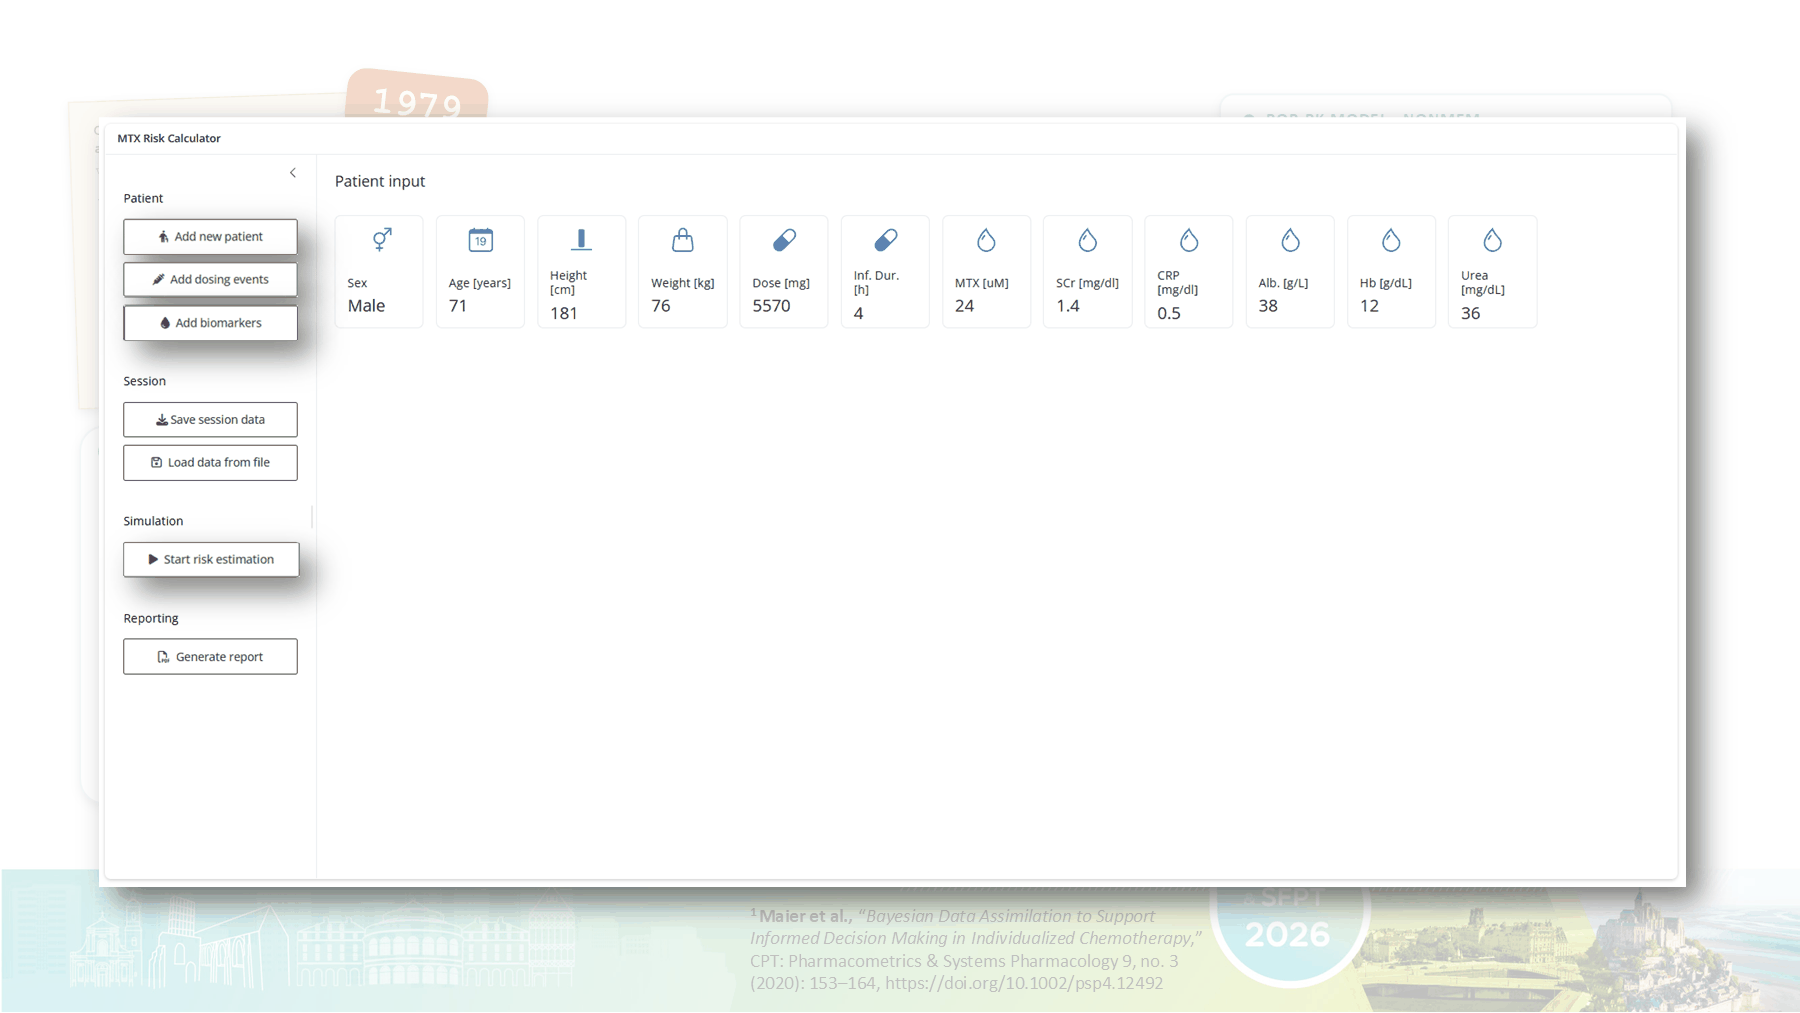
Finally, when you hit “Start risk estimation”, you do not need to wait longer than a minute
Probabilistic forecasts and risk scores
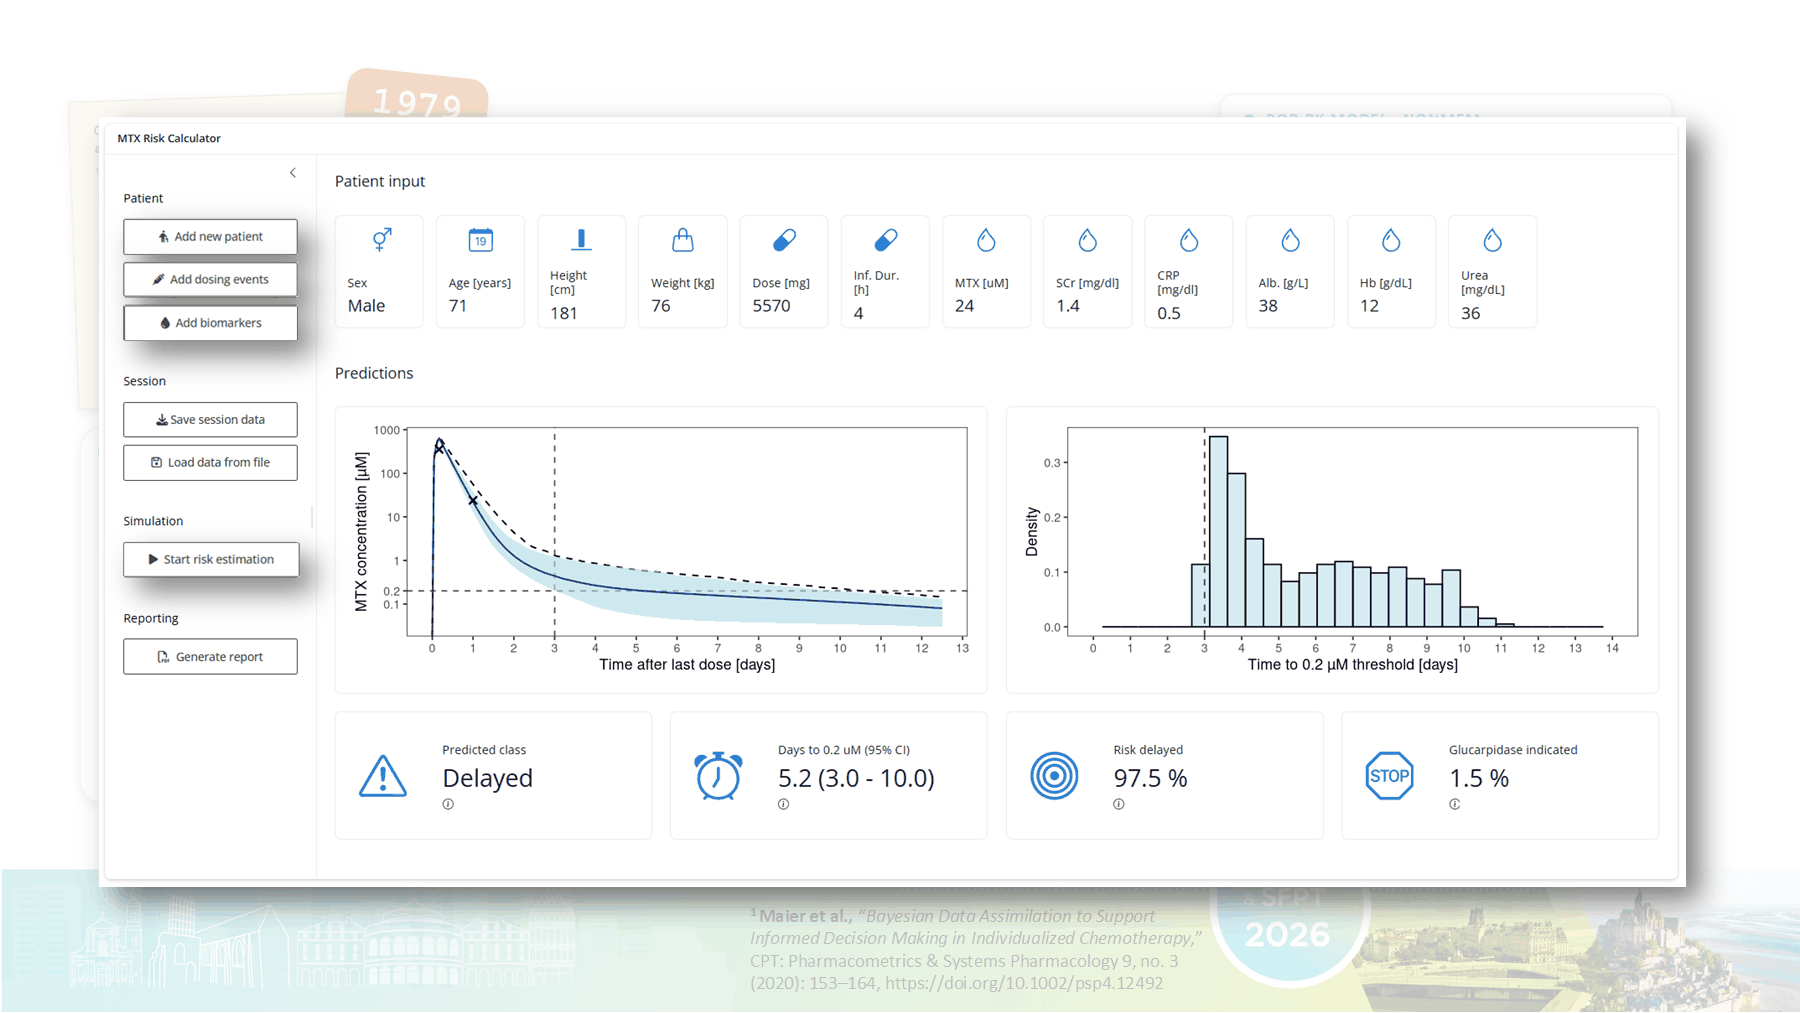
to see a probabilistic forecast based on full Bayesian inference. It does not only give you a point prediction, but also a full prediction interval, which tells you whether the data are sufficient to act upon or not.
You also get the expected distribution of the time to reach 0.2 µM. You can see that even with two TDM samples, this distribution is quite wide, showing that there is still a lot of uncertainty.
Finally, we derive risk scores from this. In this case, the patient has a high risk of delayed elimination. However, the strict FDA and EMA requirements for a glucarpidase indication are unlikely to be met later on.
Acknowledgements
Try it yourself
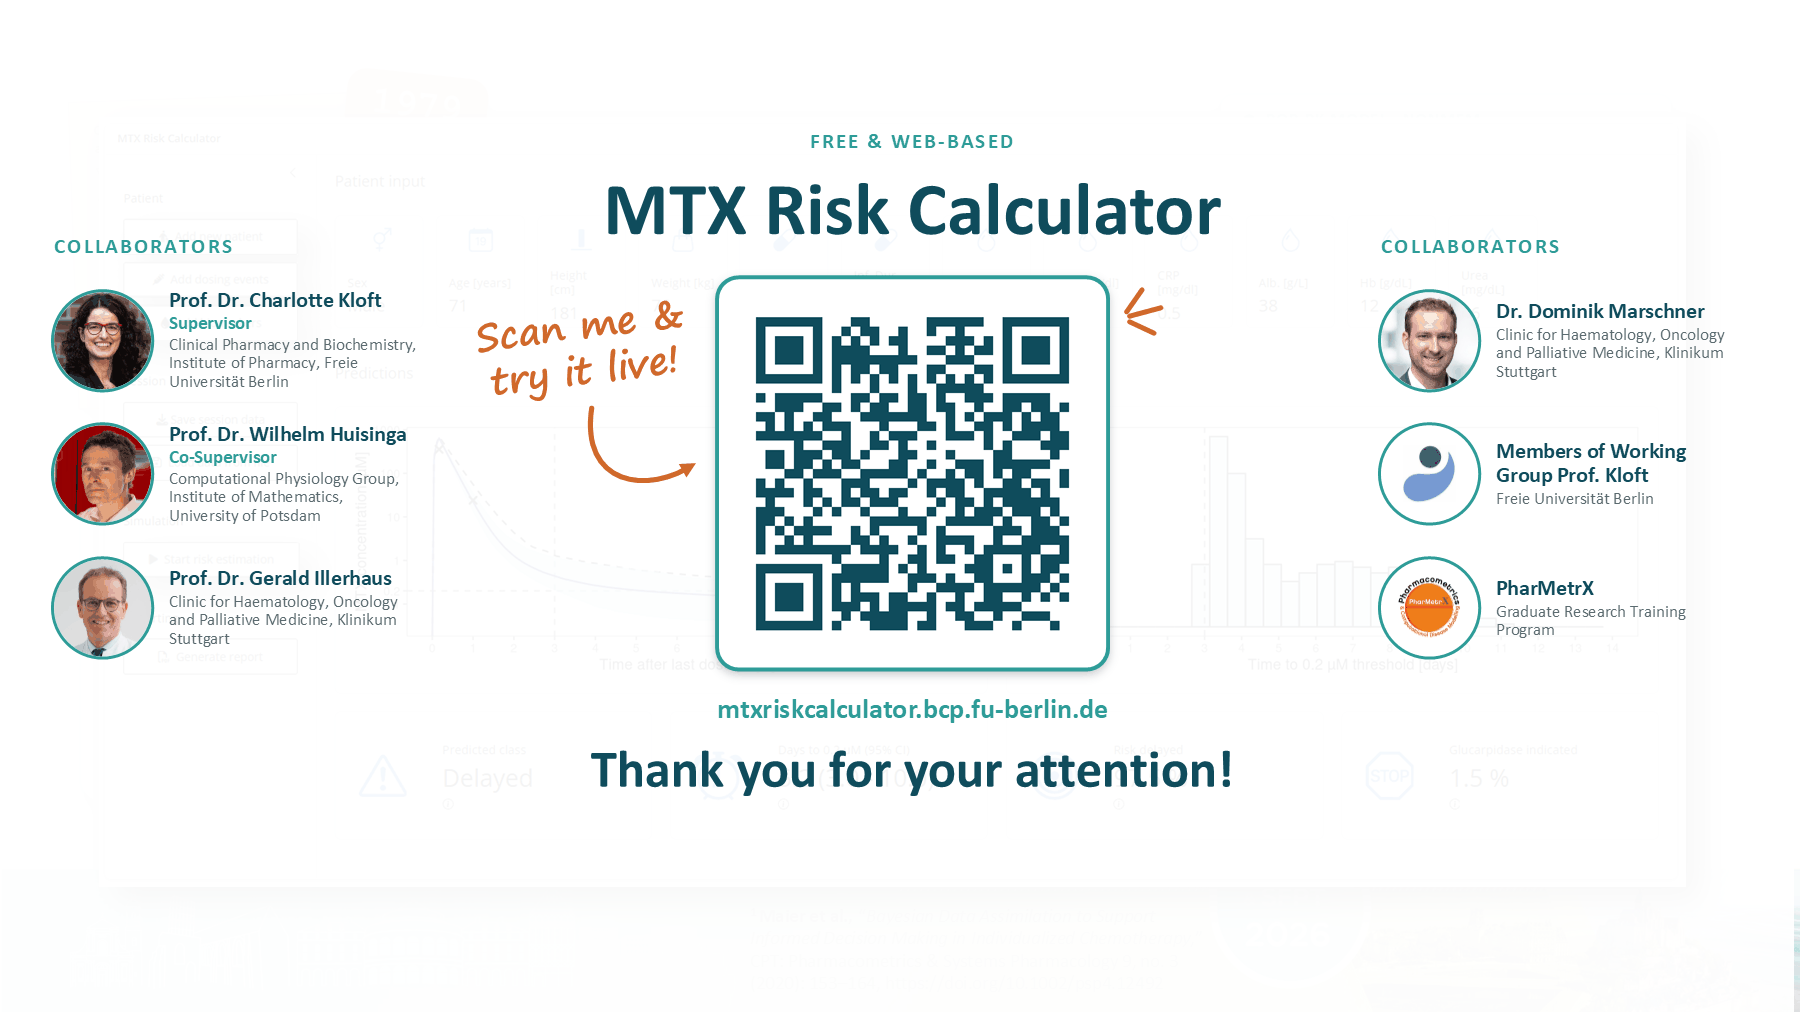
With that, I am at the end of my talk. I would like to thank everyone who supported me: my supervisor, Prof. Dr. Charlotte Kloft, my co-supervisor, Prof. Dr. Wilhelm Huisinga, and our collaboration partners, Prof. Dr. Gerald Illerhaus and Dr. Dominik Marschner. Thanks also to all members of Prof. Kloft’s working group, and to the PharMetrX graduate research training program for networking opportunities, financial support, and great exchange. Thank you very much!
If you would like to try it yourself, the MTX Risk Calculator is freely available. And again: it is not a medical device, so please do not use it for clinical decisions.
I am happy to receive feedback on what we can improve, or to hear your opinion on this topic in general. Feel free to reach out to me at marian.klose@fu-berlin.de.
From the discussion
There were several good questions after the talk and in the panel discussion. Here are the three main points as I remember them, together with my answers.
How should clinical policies be adapted?
One question was about how policies should be adapted: when should we act, and based on what? Of course, we do not have any efficacy or safety data to back this up yet. But I think it is much better if hospitals or guideline authors base their decisions on the risk of, for example, delayed elimination, or even better, on the risk of efficacy and safety outcomes. If you are very sure that the risk of a severe outcome or toxicity event is below, say, 0.1%, maybe you can send the patient home. Where exactly to draw that line depends on the hospital, the clinicians, and the guidelines, and on how much risk they are willing to take. We also need studies to establish the cutoffs.
What I argue against is the current practice of basing decisions on a TDM sample at a fixed time point, for example whether the concentration exceeds a certain value at 24 hours. This does not take into account the impact of different covariates and the other available data, and the same value can mean different things for different patients. The same concentration at a given time can correspond to a different underlying risk, for example once we also consider renal function or other risk markers. I think that relying on these TDM-based cutoff values without taking all the other risk factors into account is largely a historical habit. We were typically not able to calculate a patient’s individual risk easily, and there were not enough data to back up a risk-based approach. With MIPD, we can now actually derive that probability. Using it would mean a real switch in mindset.
Can clinicians wait a minute for the result?
Attendees from InsightRx and Zachary Taylor from MTXPK.org, another great platform that builds more sophisticated apps of this kind, asked whether clinicians can really wait a minute to get the results. Usability really matters, and I agree that a minute of waiting is problematic from a UX perspective.
However, we also have to keep in mind how long it takes to get the TDM samples in the first place. Ideally, with integration into the electronic health record (EHR), the full Bayesian forecast and the risk scores could be computed automatically as soon as the TDM results are uploaded. They would then already be available when the clinician looks at the patient. Maybe this is naive: I lack the experience to judge whether this is feasible, and whether the data in the EHR are maintained well enough for this. But I still think we should aim for this kind of automatic integration, and rely on full Bayesian approaches that are unbiased and quantify uncertainty, because this is really essential.
Is there actually a bias between MAP and full Bayesian approaches?
I was also asked whether we actually see a bias between MAP and full Bayesian approaches. I had to admit that in our own analysis, which is currently under review, we did not see any bias in the point estimates. However, we definitely saw that ignoring uncertainty can have an impact on decision-making, and we show this in our paper, which will hopefully be published soon. Especially early on, relying on overconfident MAP predictions can lead to worse decisions.
So in simple PK models, the point estimates might not be that biased. Corinna Maier et al. did show clear biases in more nonlinear PK/PD models (Maier et al. 2020). The question is how you can tell a priori whether your model is nonlinear enough to be biased. I think this is a tough challenge, and in the end, that is one more reason why I argue we should use full Bayesian approaches more.
Thanks again to everyone who asked questions and joined the discussion! If you have comments or corrections, please let me know.